Article citation information:
Macioszek, E., Lach, D. Analysis of traffic conditions at the Brzezinska and Nowochrzanowska intersection in Myslowice (Silesian Province, Poland). Scientific Journal of Silesian University of Technology. Series Transport. 2018, 98, 81-88. ISSN: 0209-3324. DOI: https://doi.org/10.20858/sjsutst.2018.98.8.
Elżbieta MACIOSZEK[1],
Damian LACH[2]
ANALYSIS
OF TRAFFIC CONDITIONS AT THE BRZEZINSKA AND NOWOCHRZANOWSKA INTERSECTION IN
MYSLOWICE (SILESIAN PROVINCE, POLAND)
Summary. A detailed analysis of traffic conditions at the
intersection allows us to obtain information about the efficiency of its
operation. This type of analysis usually involves assessing the capacity and
scale of the intersection and applying classical measures to assess its
quality. In Poland, for this purpose, methods developed by the General Directorate
for National Roads and Motorways are used to estimate the capacity of
intersections without traffic lights, intersections with traffic lights, and
roundabouts. The paper presents the results of the analysis of traffic
conditions at the intersection of Brzezinska and Nowochrzanowska Streets,
located in Myslowice (Silesian Province, Poland). The paper also examines the
findings on traffic safety at this intersection.
Keywords: traffic
conditions, intersection capacity road traffic engineering
1. INTRODUCTION
One of the basic tasks within
traffic engineering is the efficient organization and management of traffic in
dense transport networks. The implementation of these tasks in today’s world is
difficult due to the presence of these dense transport networks on the one
hand, and significant traffic volumes on the other hand. Hence, the search for
effective ways to efficiently organize and manage traffic in these networks
requires the involvement of newer and more efficient tools. In the literature
on this subject, there are numerous studies devoted to numerous aspects of
these kinds of problems, as well as other relevant problems of a technical
nature [1-10,12,13].
A detailed analysis of traffic
conditions at the intersection allows us to obtain information about the
performance of the intersection. This information is necessary, both for the
design and for the modernization of intersections. This type of analysis
usually involves estimating the capacity and scale of intersections and
applying classical measures to assess the quality of their operation. Depending
on the location and the country in which the analysed intersection is located
in the capacity calculation, adequate methods are used. In Poland, methods were
developed in 2004 by the General Directorate for National Roads and Motorways.
These methods allow for the estimation of crossing capacity without traffic
lights, intersections with traffic lights, and roundabouts. The paper presents
the results of the analysis of traffic conditions at the three-lane
intersection at Brzezinska and Nowochrzanowska Streets, located in Myslowice
(Silesian Province, Poland).
Myslowice is located
·
Brzezinska
Street (south entry) – Entry A
·
Brzezinska
Street (north entry) – Entry B
·
Nowochrzanowska
Street (east entry) – Entry C
2. CHARACTERISTICS
OF THE BRZEZINSKA AND NOWOCHORZOWSKA INTERSECTION
Before measuring the traffic,
information on the geometry of the intersection was collected. At Entries A and
B, the lane widths are the same, i.e., 3.50 m. At Entry C, the carriageway is
narrower, with the width of each lane being 3.25 m. The geometry of the
intersection is shown in Figure 1a.
In terms of traffic
organization, the traffic at the intersection is regulated by road signs. At
Entries A and B, there are D-1 signs, which inform drivers of the road ahead.
At Entry C, there is a B-20 sign directing drivers to enter the intersection
after stopping before the road with priority of passage. A diagram of the
traffic organization at the intersection is shown in Figure 1b.
|
a) |
b) |
|
|
|
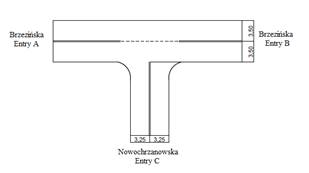
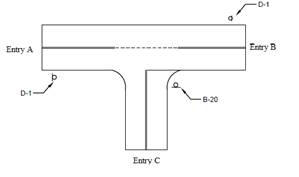
Fig. 1. Intersection of Brzezinska and Nowochrzanowska
Streets in Myslowice
(Silesian Province, Poland): a) diagram of the geometry of the intersection,
b) scheme of traffic control
The crossroads are
characterized by a significant number of public transport lines. Over the
course of the day, you can see an increase in the amount of short and
articulated buses. The nearest bus stop is about 100 m from the intersection,
while its location has no significant impact on traffic conditions at the
intersection because of the limited number of courses on Nowochrzanowska Street
(once an hour). There is not too much traffic in the traffic, and there is a
crossing for several public facilities in the area. Pedestrian crossings are
within a few dozen metres of the intersection. The nearest crossing is at Entry
C, which is about
A large and
notorious recurring problem at the intersection is the service of left- and
right-turning vehicles. The problem is particularly evident in traffic rush
hours when the waiting time for entering from Entry C is potentially much
longer than at the other entries. By anticipating a continuous and systematic
increase in the number of vehicles on the road network, it can be said that
this problem will intensify.
3. TRAFFIC MEASUREMENT AT THE INTERSECTION
Traffic intensity
measurements were needed to collect the necessary data to perform calculations,
which would allow us to analyse the capacity of the intersection and evaluate
the traffic conditions. Several hours of traffic measurements were made at the
intersection. Measurements were made using the manual method (writing on forms)
in 15 min intervals, with reference to the following generic structure of
passing vehicles: passenger cars and vans (SOD), buses (A), lorries (SC), articulated
buses (AP), lorries with trailers (SCP), motorcycles and bikes (M/R).
Measurements were made under favourable weather conditions, i.e., without
precipitation in sunny weather. In addition, the measurements were smooth.
The results of the
traffic measurements illustrate the structure type of the vehicles, as well as
the distribution of traffic in 15 min intervals. It should be noted that, at
the analysed intersection, passenger cars and vans were more commonly observed
than other vehicle types. Buses and articulated buses were most commonly found
at Entry A, while the largest number of trucks was recorded at Entry C.
Motorcyclist and cyclist traffic was limited. Pedestrian traffic was also
limited and did not affect the functioning of the junction in question. The
rush hour was between 16:00 and 17:00. Traffic during rush hour was at the
level of 1,365 vehicles/h. The results of traffic measurements on Entries A, B
and C are presented in Tables 1-3. These data provided the basis for the
calculation of crossing capacity.
Tab. 1
Summary of traffic measurement results for Entry
A
|
Relation |
Traffic in
straight relation [vehicles/h] |
Traffic in
relation to right [vehicles/h] |
||||||||||
|
Measurement
intervals [min] |
SOD |
A |
AP |
SC |
SCP |
M/R |
SOD |
A |
AP |
SC |
SCP |
M/R |
|
16.00-16.15 |
100 |
2 |
0 |
0 |
2 |
0 |
28 |
0 |
0 |
1 |
0 |
1 |
|
16.15-16.30 |
103 |
2 |
0 |
1 |
1 |
0 |
29 |
0 |
0 |
0 |
0 |
0 |
|
16.30-16.45 |
102 |
1 |
1 |
0 |
0 |
2 |
28 |
0 |
0 |
1 |
1 |
0 |
|
16.45-17.00 |
99 |
0 |
2 |
1 |
0 |
0 |
30 |
0 |
0 |
1 |
0 |
1 |
|
Total |
404 |
5 |
3 |
2 |
3 |
2 |
115 |
0 |
0 |
3 |
1 |
2 |
Tab. 2
Summary of traffic measurement results for Entry B
|
Relation |
Traffic in
straight relation [vehicles/h] |
Traffic in
relation to left [vehicles/h] |
||||||||||
|
Measurement
intervals [min] |
SOD |
A |
AP |
SC |
SCP |
M/R |
SOD |
A |
AP |
SC |
SCP |
M/R |
|
16.00-16.15 |
111 |
1 |
1 |
0 |
0 |
1 |
28 |
0 |
0 |
1 |
0 |
1 |
|
16.15-16.30 |
116 |
1 |
1 |
1 |
1 |
1 |
28 |
0 |
0 |
2 |
1 |
0 |
|
16.30-16.45 |
115 |
0 |
1 |
2 |
0 |
0 |
27 |
0 |
0 |
0 |
1 |
0 |
|
16.45-17.00 |
109 |
1 |
1 |
0 |
0 |
2 |
25 |
1 |
0 |
1 |
0 |
1 |
|
Total |
451 |
3 |
4 |
3 |
1 |
4 |
108 |
1 |
0 |
4 |
2 |
2 |
Tab. 3
Summary of traffic measurement results for Entry C
|
Relation |
Traffic in
relation to left [vehicles/h] |
Traffic in
relation to right [vehicles/h] |
||||||||||
|
Measurement intervals
[min] |
SOD |
A |
AP |
SC |
SCP |
M/R |
SOD |
A |
AP |
SC |
SCP |
M/R |
|
16.00-16.15 |
18 |
0 |
0 |
2 |
1 |
0 |
29 |
0 |
0 |
1 |
0 |
0 |
|
16.15-16.30 |
19 |
0 |
0 |
1 |
1 |
0 |
28 |
1 |
0 |
0 |
0 |
1 |
|
16.30-16.45 |
17 |
0 |
0 |
0 |
3 |
0 |
28 |
0 |
0 |
1 |
2 |
0 |
|
16.45-17.00 |
19 |
0 |
0 |
1 |
0 |
0 |
26 |
0 |
0 |
2 |
0 |
0 |
|
Total |
73 |
0 |
0 |
4 |
5 |
0 |
111 |
1 |
0 |
4 |
2 |
1 |
4. CAPACITY OF INTERSECTION IN EXISTING STATE
The highest value
for actual capacity is given with regard to Entry A, i.e., 1,729 vehicles/h. In
turn, the lowest actual capacity was obtained for Entry C, i.e., 197
vehicles/h. Apart from the capacity values, the quality of the intersection was
also determined. The average loss of time across the intersection was 21.49
s/vehicle. The levels of traffic freedom and the length of reliable queues were
determined for all entries. At Entry C, the longest queue consisted of nine
vehicles.
5. ANALYSIS OF ROAD TRAFFIC SAFETY AT THE
INTERSECTION
On the basis of the data on the number and types of traffic incidents at
the analysed intersection, a comparative characterization of the calculated
coefficients was made. For the analysed intersection, data covering the period
from 1 January 2006 to 31 October 2017 were obtained. The structure of traffic
incidents is shown below.
In the given period, 27 road events. At the intersection, only one
accident occurred in this period, in which only one person was injured. No
fatalities were recorded for any traffic incident. The remainder involved road
collisions, in which neither injuries nor fatalities were registered. In the
analysed period, the following types of vehicles took part in road incidents:
SO (passenger cars), M (motorcycles), SC (lorries), SCP (lorries with
trailers), A (buses) and I (others, e.g., bikes, low-speed vehicles). There
were no traffic incidents involving light trucks (LSC) and agricultural
tractors (CR). The accident that led to one person being injured person
concerned a passenger car and a lorry without a trailer. Most road accidents
occurred between passenger cars. Most probably, these were on account of
forcing the right of way through the intersection. Figure 2 presents a summary
of the number of traffic incidents in the analysed period. The largest number
of road accidents was in 2007.
Fig. 2. Number of traffic incidents on
crossroads in Myslowice (Silesian Province, Poland)
The characteristics
of the generic structure of vehicles participating in road incidents at the
analysed intersection are diversified. Figure 3 shows the given
characteristics. It should be noted that the majority of vehicles are passenger
cars.
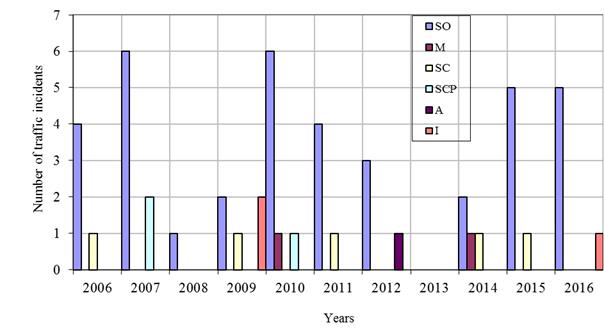
Fig. 3. Generic structure of vehicles involved
in traffic incidents at crossroads in Myslowice (Silesian Province, Poland)
Road traffic
incidents were analysed in terms of the months of occurrence. The road accident
described earlier took place in September 2009. Figure 4 shows the number of
road incidents divided into months for the analysed period.
6. CONCLUSIONS
The main objective
of the presented analysis was to evaluate traffic conditions at the
intersection of Brzezinska and Nowochrzanowska Streets, located in Myslowice (Silesian Province, Poland). The determined
values of the functional quality of the intersection allows us to state that
the greatest values for time losses were incurred by drivers at Entry C, i.e.,
128.71 s/vehicle. In turn, the smallest time losses were incurred by
drivers at Entry A, i.e., 1.23 s/vehicle. This confirms that Entry A is the
most efficient in functional terms. The characteristics of traffic conditions
at the entries allows us to state that, for Entries A and B, the level of traffic
freedom is PSR I, while, for Entry C, it is PSR IV, which indicates that
drivers of vehicles passing through this entry cannot effectively cross the
examined intersection. We also estimated the lengths of reliable vehicle queues
for each entry. The longest car queue formed at Entry C and consisted of nine
vehicles, while the shortest formed at Entry A and consisted of two vehicles.
During the analysis of road safety at the intersection, it was noted that:
-
The largest group of vehicles involved in road
incidents comprised passenger cars (38 vehicles throughout the analysis period)
-
Vehicles from the LSC or CR group were not involved in
road incidents
-
The most traffic incidents occurred in 2007 (four
traffic incidents) and the least in 2013 (zero traffic incidents)
-
The most traffic incidents occurred in September (five
traffic incidents) and the least occurred in January (zero traffic incidents)
Fig. 4. Number of traffic incidents
in certain months at crossroads in Myslowice
(Silesian Province, Poland)
The analysis and
assessment of traffic conditions at the intersection of Brzezinska and
Nowochrzanowska Streets in Myslowice could inform the decision to change the
traffic organization at the intersection, e.g., by constructing an additional
lane at Entry C or installing traffic lights. Such a change could improve the
traffic conditions at Entry C, where unsatisfactory traffic conditions were
observed for drivers. However, such a decision requires further detailed
analysis in this regard.
References
1.
Coelho Margarita, Farias Tiago, Rouphall Nagui. 2006.
“Effect of roundabout operations on pollutant emissions”. Transportation Research Part D: Transport and Environment 11(5):
333-343. ISSN: 1361-9209. DOI: 10.1016/j.trd.2006.06.005.
2.
Duduta N., C. Adriazola, D. Hidalgo, L.A. Lindau, R.
Jaffe. 2014. “Traffic safety in surface public transport systems: a synthesis
of research”. Public Transport 7(2):
121-137.
3.
Feng W., M. Figliozzi, R.L. Bertini. 2015.
“Quantifying the joint impacts of stop locations, signalized intersections, and
traffic conditions on bus travel time”. Public
Transport 7(3): 391-408.
4.
Flannery Aimee. 2001. “Geometric design and safety
aspects of roundabouts”. Journal of the Transportation
Research Board 1751: 76-81. ISSN: 0361-1981. DOI: http://dx.doi.org/10.3141/1751-09.
5.
Jacyna, M.; Merkisz, J. 2014. “Proecological approach
to modelling traffic organization in national transport system”. Archives of Transport 2(30): 43-56.
6.
Jacyna-Gołda I.,
Izdebski M., Podviezko A. 2017. “Assessment of efficiency of assignment of vehicles to
tasks in supply chains: A case study of a municipal company”. Transport 32(3): 243-251.
7.
Małecki
Krzysztof, Piotr Pietruszka, Stanisław Iwan. 2017. “Comparative analysis of
selected algorithms in the process of optimization of traffic lights”. Lecture Notes in Computer Science 10192:
497-506. ISSN: 0302-9743. DOI: 10.1007/978-3-319-54430-4.
8.
Małecki Krzysztof, Jarosław Wątróbski. 2017. “Cellular
automaton to study the impact of changes in traffic rules in a roundabout: a
preliminary approach”. Applied Sciences
7(7): 742. EISSN 2076-3417. DOI: 10.3390/app7070742.
9.
Martin T., L.
Choummanivong, T. Thoresen. 2017. “The influence of maintenance on
unsealed road performance”. Road &
Transport Research: A Journal of Australian and New Zealand Research and
Practice 26(3).
10. Shekhar Babu S., P. Vedagiri. 2017. “Traffic Conflict Analysis of
Unsignalised Intersections under Mixed Traffic Conditions”. Transport\Transporti Europei 66(4)10.
11. Statystyczne Vademecum Samorządowca. “Dane statystyczne miasta Mysłowice”. [In Polish: Statistical Vade
Mecum for Local Government. “Statistical data for the city of Mysłowice”.]
Available at:
http://katowice.stat.gov.pl/vademecum/vademecum_slaskie/portrety_miast/miasto_myslowice.pdf.
12.
Stopka O., B. Sarkan, M.
Chovancova, L.M. Kapustina. 2017. “Determination of the appropriate vehicle
operating in particular urban traffic conditions”. Communications -
Scientific Letters of the University of Zilina 19(2): 18-22.
13. Wasiak M., M. Jacyna, K. Lewczuk, E. Szczepański. 2017. “The method
for evaluation of efficiency of the concept of centrally managed distribution
in cities”. Transport 32(4): 348-357.
Received 19.11.2017; accepted in revised form 11.02.2018
![]()
Scientific Journal of
Silesian University of Technology. Series Transport is licensed under
a Creative Commons Attribution 4.0 International License