Article
citation information:
Pil’a, J., Ojciec, M., Balcerzak,
T. Investigation
into the production flaws in thin solid carbon laminates by using the
ultrasonic phased array method. Scientific
Journal of Silesian University of Technology. Series Transport. 2018, 101, 141-148. ISSN: 0209-3324. DOI: https://doi.org/10.20858/sjsutst.2018.101.13.
Jan PIL’A[1], Mateusz OJCIEC[2], Tomasz BALCERZAK[3]
INVESTIGATION INTO
THE PRODUCTION FLAWS IN THIN SOLID CARBON LAMINATES BY USING THE ULTRASONIC
PHASED ARRAY METHOD
Summary.
Composites
are used in a wide variety of markets, including the aerospace, architecture,
automotive and military sectors. Along with the increased use of composites,
multiple non-destructive testing (NDT) methods have been further developed specifically
for inspecting them. Among them, one can single out ultrasonic phased arrays.
Research described in this article focuses on the use of ultrasonic PAs for
production flaw investigations into an aileron. The examined part was made of
up to 16 layers of BAER 3068 epoxy carbon prepreg. The investigation was
carried out by using the tap test, conventional ultrasonic measurement and
phased array methods. The phased array method allowed us to thoroughly check
the affected specimen and confirm the presence of a production flaw in the form
of epoxy resin build-up. The results show how effective this method can be and
emphasize its advantages over traditional ultrasonic inspections.
Keywords:
carbon;
composites; CFRP; non-destructive testing; ultrasonic phased array
1.
INTRODUCTION
Composite
materials are made by combining two or more base materials with significantly
different properties, which, after being combined, have unique properties
different to those of base components. Despite being connected, when looking
closely at the composite structure, one can still see the different materials
as they do not blend or dissolve together. The new material may be preferred
for reasons such as higher strength, lighter weight or lower cost when compared
to traditional materials. Composites are used in a wide variety of markets,
including the aerospace, architecture, automotive, military and household goods
sectors. [1]. Along with the increased use of composites, multiple NDT methods
have been further developed specifically for examining them. These inspections
can range from the manufacturing process and continue with routine and
non-routine inspections throughout the components’ life [2]. Except for
visual checks, which are commonly used in all industries, many other methods
such as thermography, acoustic emission, eddy current and ultrasonic testing
have been investigated and used for inspecting composites. The selection of
investigation method can be dependent on multiple factors such as the physical
properties of the reviewed specimen (size, shape etc.) or the
manufacturer’s instructions (for example, NDT manuals in aviation, which
differ for each type of aircraft) [3-4]. Ultrasonic testing (UT) is
a well-established technique based on the vibration of materials. It can
be used for both composite and metal structures. The inspection of carbon fibre
reinforced polymer (CFRP) components with UT is subject to strict requirements
in terms of ensuring reliable and time efficient NDT. Examining composites
carries some major technical challenges such as the attenuation, scattering and
absorption of the signal and the shadowing effect of multiple damage can have
an influence on the received results. The majority of these difficulties can be
overcome by using phased array ultrasonic testing (PAUT), involving signal
processing and correction with advanced algorithms, such as the threshold
modified S-transform (TSMT), combined with multiple pulser-receiver elements
working together [5-7,12]. Research described in this article has been done in
order to determine whether visible irregularity in the composite skin structure
of an aileron is a production flaw or another kind of defect. In order to do
this, several methods have been used, as described in the following chapters.
2.
BASICS OF ULTRASONIC PHASED ARRAY NDT METHOD AND EQUIPMENT
Traditional
ultrasonic transducers used for non-destructive testing consist of a single
active element or a pair of elements. Meanwhile, an UT phased array transducer
consists of between 16 and 256 individual elements, which can be pulsed
separately from each other. These elements are coordinated by a complex
computer-based instrument, which is integrated into the array. This instrument
is capable of driving the multi-element probe, receiving echoes and converting
them into a digital format, as well as mapping the echoes in a variety of
formats [8].
Phased
array systems work, based on the wave physics law of phasing, which changes the
time between a range of outgoing ultrasonic pulses. This is done in such a
way that the separate wave fronts produced by elements in the array merge
together, in turn increasing or decreasing the total energy in a desired way,
which allows for the effective guidance of the sound beam. In order to realize
such a situation, each of the individual probe elements is pulsed at different
times. A focal law calculator calculates each group’s firing time delays
to achieve the desired beam shape. The beam shape is dependent on probe
characteristics as well as the geometry and acoustical properties of the
inspected element. The pulsing sequence is chosen by the instrument’s
operating software and introduces several wave fronts in the test material.
Once inside, the wave fronts merge together and pass via the material to reflect
off the back walls (back wall echo), as well as discontinuities, cracks and
other boundaries, such as delaminations [9]. Measurements can be presented in
A-scan, B-scan, C-scan and S-scan modes. The A-scan represents the
amplitude and time of an ultrasonic signal. Additionally, the A-scan waveform
denotes reflections from a single sound beam position in the tested
material. The S-scan denotes a two-dimensional (2D) cross-sectional
view obtained from a range of A-scans, which are mapped in accordance with the
refracted angle and time delay. B-scan imaging examines the material
with a sound beam moving along the preferred axis. A C-scan is a 2D presentation of data, which appears as a top view of a
test piece [5].
3.
DESCRIPTION OF EXPERIMENT
During
the redelivery process of an Airbus A319, one of the technical representatives
indicates his suspicion that two delaminated spots are present on the outboard
edge of an aileron. To prove that these are not delaminated areas but
production flaws, it is decided to probe them by using a tap test, conventional
ultrasonic measurement and the phased array method. These methods are selected
because they are approved by Airbus and the preferred methods for testing
composite structures in NDT manuals. In the thickest area, the inspected
component is made of 16 layers of epoxy prepreg carbon fabric (5H satin weave).
This type of prepreg contains 45% epoxy resin and, during manufacture, is cured
at 180°C. This material meets the requirements given in the BAER 3068 specification.
Figure 1 depicts the section of the aileron that was inspected. The closer to
the centre, the fewer the cloth layers present, thus the element thickness is
reduced.
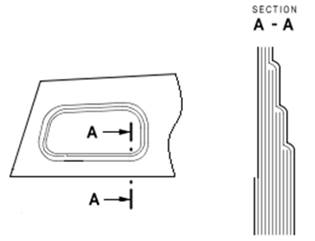
Fig. 1.
Drawing of the aileron segment with a sectional view of carbon layers
In order
to perform the examination, a plies layout is drawn on the aileron, along with
10x10 [mm] grid mapping over the areas where the production flaw is suspected.
The first phase of this investigation is done by the tap test method [10] using
a certified Airbus tap test tool. It is possible to notice a slight change in
sound during the test; however, it is not typical and, as a result, it is
insufficient proof to come to a conclusion. As such, further testing is
required.
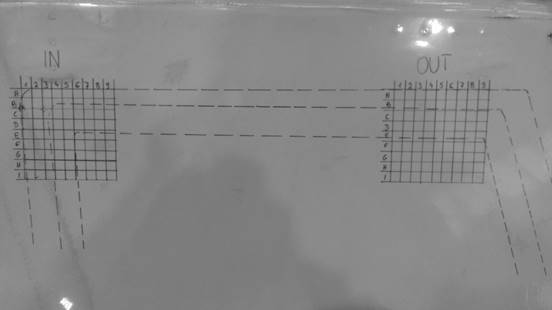
Fig. 2.
Aileron segment with the drawn thickness change layout
and a grid over the suspected area
The
next step requires the use of the PAUT method. Olympus Omniscan SX is used
together with an Olympus RollerFORM-5L64-5 probe. In order to overcome the lack
of calibration block, the equipment is manually set to the speed of sound in
carbon (approximately 3,000 ![]() ) [11]. The
remaining settings, such as gain, frequency and range, are set according to
Chapter 51-10-06 of the Airbus
Non-Destructive Testing Manual for phased array inspections of carbon
monolithic components. The company where the experiment is performed does not
have a proper calibration block for CFRP testing. However, in the case of this
particular experiment, obtaining an exact thickness value is not of the highest
importance; thus, an approximate value is satisfying. Water is used as a
couplant. The alarm gate value is set at 1.5 and 3 mm. Arranging the gate
values in this way causes the received image to clearly indicate any possible
defects. Setting the gate values in a given manner is possible as it is not
necessary to satisfy any requirements regarding minimum material thickness. The
results of this investigation can be seen in Figures 3 and 4 below. After the
PAUT measurements are finished, UT measurement of the previously prepared grid
mapping is also been performed. The results of this measurement can be found in
Table 1. Equipment for this measurement is calibrated using the same NTM
chapter; however, the instructions are specific to the conventional UT of carbon
composite monolithic structures.
) [11]. The
remaining settings, such as gain, frequency and range, are set according to
Chapter 51-10-06 of the Airbus
Non-Destructive Testing Manual for phased array inspections of carbon
monolithic components. The company where the experiment is performed does not
have a proper calibration block for CFRP testing. However, in the case of this
particular experiment, obtaining an exact thickness value is not of the highest
importance; thus, an approximate value is satisfying. Water is used as a
couplant. The alarm gate value is set at 1.5 and 3 mm. Arranging the gate
values in this way causes the received image to clearly indicate any possible
defects. Setting the gate values in a given manner is possible as it is not
necessary to satisfy any requirements regarding minimum material thickness. The
results of this investigation can be seen in Figures 3 and 4 below. After the
PAUT measurements are finished, UT measurement of the previously prepared grid
mapping is also been performed. The results of this measurement can be found in
Table 1. Equipment for this measurement is calibrated using the same NTM
chapter; however, the instructions are specific to the conventional UT of carbon
composite monolithic structures.
4.
ANALYSIS OF RESULTS
Figures
3 and 4 are screenshots taken directly from the Olympus scanner. Based on these
figures, as well as Table 1, it can be easily determined that no damage is
present at the inboard corner of the suspected area. There is no visible change
in material thickness, which would indicate delamination or other damage both
on the UT measurement and PAUT scans. In terms of the outboard edge, it can be
seen that there is an irregularity (slightly brighter colour on the C-scan
image in Figure 3). This irregularity has also been detected by traditional UT
measurement (cells E3-E6, F3-F5 and G3-G5, as seen in Table 1). It can be
noticed that thickness values within these cells are around 0.05-0.12 [mm]
lower than in the surrounding area. For further investigation purposes, it is
necessary to refer to the A-S-scan image (Figure 4). In this picture, one can
see that the composite layers are intact, as a good back wall echo has been
received on the entire scan length. In turn, it is possible to confirm that no
structural damage is present on the examined segment of the aileron. The final
question that needs to be answered concerns why there is a change in thickness
indicated on the outboard corner. In the middle C-scan image, as seen in Figure
3, one can notice a white area in the spot where we have observed a thickness
change. This means that there was a lower dampening of ultrasonic signal,
probably caused by a larger amount of resin. This accumulation of resin might
have occurred during the manufacture of the aileron as it was made of epoxy
prepreg material. Thus, it can be called a production flaw.
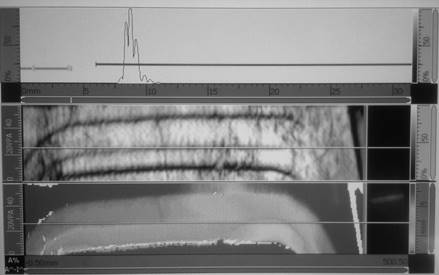
Fig. 3.
A-C-C-scan views of the inspected sample
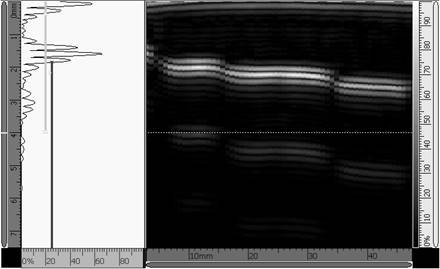
Fig. 4.
A-S-scan images of the examined part of the aileron
In
order to have the opportunity to compare the results received through PAUT,
additional measurements were made with a traditional UT probe CLF-4 and Olympus
Panametric 35DL meter. The instrument has been calibrated as a given in the
aircraft’s NDT manual, with the speed of sound propagation in CFRP
structures manually selected. Again, as in the case of PAUT, measurement
reference standards were not available to check the calibration. However,
thickness values read during the measurement matched the ones obtained during
the phased array scan. This measurement was done using 10x10 [mm] grid mapping.
The results of this measurement are presented in the table below. This table
contains thickness values measured in the grid, as seen in Figure 2. These values
represent the depth at which the back-wall echo has been received. If the value
is lower than in the surrounding cells of the same material thickness, this can
be interpreted as a flaw or defect in the inspected component. Such dependence
can be seen in cells E3-E6, F3-F5 and G3-G5 of the outboard grid.
Table
1.
Results
of UT measurement involving 10x10mm grid mapping over areas of the suspected
production flaw
|
1 |
2 |
3 |
4 |
5 |
6 |
7 |
8 |
9 |
|
|
A |
2.54 |
2.51 |
2.56 |
2.55 |
2.54 |
2.56 |
2.53 |
2.53 |
2.54 |
|
B |
2.56 |
2.56 |
2.57 |
2.59 |
2.57 |
2.49 |
2.52 |
2.52 |
2.57 |
|
C |
2.56 |
2.57 |
2.57 |
2.48 |
2.41 |
2.29 |
2.29 |
2.29 |
2.27 |
|
D |
2.56 |
2.57 |
2.45 |
2.24 |
2.30 |
2.29 |
2.27 |
2.27 |
2.17 |
|
E |
2.57 |
2.40 |
2.27 |
2.30 |
2.23 |
1.98 |
2.03 |
2.03 |
1.95 |
|
F |
2.42 |
2.28 |
2.21 |
1.98 |
1.94 |
1.37 |
1.35 |
1.35 |
1.38 |
|
G |
2.30 |
2.21 |
1.94 |
1.62 |
1.17 |
1.23 |
1.18 |
1.18 |
1.34 |
|
H |
2.26 |
2.01 |
1.62 |
1.48 |
1.27 |
1.25 |
1.22 |
1.22 |
1.34 |
|
I |
2.10 |
1.91 |
1.52 |
1.47 |
1.42 |
1.50 |
1.39 |
1.39 |
1.42 |
|
|
|||||||||
|
OUTBD |
1 |
2 |
3 |
4 |
5 |
6 |
7 |
8 |
9 |
|
A |
2.40 |
2.44 |
2.42 |
2.45 |
2.48 |
2.52 |
2.54 |
2.57 |
2.57 |
|
B |
2.61 |
2.41 |
2.40 |
2.42 |
2.48 |
2.50 |
2.56 |
2.52 |
2.58 |
|
C |
2.02 |
2.05 |
2.06 |
2.09 |
2.13 |
2.14 |
2.28 |
2.50 |
2.57 |
|
D |
2.06 |
2.01 |
2.02 |
2.01 |
2.06 |
2.16 |
2.22 |
2.25 |
2.54 |
|
E |
1.92 |
1.83 |
1.77 |
1.75 |
1.74 |
1.81 |
1.93 |
2.20 |
2.25 |
|
F |
1.43 |
1.39 |
1.31 |
1.27 |
1.33 |
1.88 |
1.96 |
2.01 |
2.28 |
|
G |
1.43 |
1.39 |
1.35 |
1.33 |
1.37 |
1.42 |
1.46 |
2.21 |
2.05 |
|
H |
1.42 |
1.41 |
1.42 |
1.42 |
1.43 |
1.47 |
1.50 |
1.53 |
2.17 |
|
I |
1.46 |
1.47 |
1.46 |
1.49 |
1.51 |
1.53 |
1.54 |
1.54 |
1.55 |
|
Note: all dimensions in [mm] |
|||||||||
5.
CONCLUSIONS
The
phased array method allowed us to thoroughly check the affected specimen and
confirm the presence of a production flaw in the form of epoxy resin build-up.
The major advantage of this method over traditional UT testing is that the
array covers a much larger area. The software facilitates grid mapping over the
scanned image and automatically fills it with measured thickness values. Thus,
this inspection is much quicker and easier to perform. Additionally, PAUT
equipment is capable of performing all four types of scans and saving the
images, which makes analysis of the results a lot easier. Additionally, it
is possible to transfer an entire scan file into a PC or a laptop and work with
it in the same way as on the scanner. The presentation of results is clearer
and does not require drawing grids on inspected components. By using a range of
colours, PAUT equipment makes it easier to spot irregularities compared to
tables with thickness values. In the case of this investigation, it is much
easier to spot the production flaw in the A-C-C-scan image (Figure 3) than to
find it based on material thickness values, as given in Table 1. It is possible
to view the measured thickness of any point within the scan range by manually
selecting the focus point. This is very useful when measurements are made in
close proximity to thickness steps, as was the case in this experiment. The
PAUT method produced the clearest indication of all the methods used to
investigate whether the defect was a production flaw.
The
PAUT method can be used in a variety of situations and on different materials
such as aluminium alloys, CFRP, GFRP and GLARE. Additionally, this method can
be used on both monolithic composites and honeycomb structures (depending on
their thickness). Most of the major aircraft manufacturers, such as Airbus or
Boeing, approve this method for aircraft maintenance. While the equipment and
training of personnel can be quite costly, this method is much more
time-efficient than traditional UT measurements and capable of lowering NDT man
hours required for aircraft maintenance. Phased array measurement, as described
in this article, took approximately 15 min, including the hardware set-up. The
ability to use water as a couplant makes the phased array method more universal
(as water is widely available) compared to conventional ultrasonic
measurements, which often require the use of gels or pastes for coupling
purposes.
Last,
but not least, PAUT examinations of composite structures are going to be used
more widely in the very near future, as new aircraft, such as the Boeing 787
and the Airbus A350, use many more composites compared to the previous
generation of airplanes. Indeed, both the Boeing 787 and the Airbus A350 have
bonded skin stiffeners and solid carbon laminate fuselages, which can be easily
inspected for possible damage by using this method.
References
1.
Kappatos
V. 2016. “Theoretical Assessment of Different Ultrasonic Configurations
for Delamination Defects Detection in Composite Components”. Proceedings of the Fifth
International Conference in Through-life Engineering Services: 29-34. Cranfield: Cranfield University.
2.
Armstrong K.B., R.T. Barrett. 1998. Care and Repair
of Advanced Composites. Warrendale, PA: Society of Automotive Engineers,
Inc.
3.
Hsu, D.K. “Nondestructive Evaluation of Damage
in Composite Structures”. Proceedings
of the 21st Technical Conference of the American Society for Composites:
1-14. Dearborn, MI.
4.
Buynak C.F., C.F.
Moran. 1987. “Characterization of Impact Damage in Composites”. Review of Progress in Quantitative NDE
6B: 1203-1211. New York, NY: Plenum Press.
5.
Holmes C., B.W. Drinkwater, P.D. Wilcox.
2008. “Advanced
Post-processing for Scanned Ultrasonic Arrays: Application to Defect Detection
and Classification in Non-destructive Evaluation”. Ultrasonics 48(6-7): 636-642.
6.
Senyurek V.Y., A. Baghalian, S. Tashakori.
2018. “Localization of Multiple Defects Using the Compact Phased Array
(CPA) Method”. Journal of Sound and
Vibration 413: 383-394.
7.
Abdessalem B., S. Redouane. 2015.
“Enhancement of Phased Array Ultrasonic Signal in Composite Materials
Using TMST Algorithm. Proceedings of the
2015 ICU International Congress on Ultrasonics. 70: 488-491. Metz, France.
8.
Chatillon S., G. Cattiaux, M. Serre. 2000.
“Ultrasonic Non-destructive Testing of Pieces of Complex Geometry with a
Flexible Phased Array”. Ultrasonics
38(1-8): 131-134.
9.
Kumar S., H. Furuhashi. 2018. “Characteristics of an
Ultrasonic Phased Array Transmitter in Medium Range”. Ultrasonics 82: 331-335.
10.
Hsu D.K., D.J. Barnard, J.J. Peters. 2000.
“Physical Basis for Tap Test as a Quantitative Imaging Tool for Composite
Structures on Aircraft”. Review of
Progress in Quantitative Nondestructive Evaluation 19: 1857-1864. Ames, IA.
11.
Jalili M.M., S.Y. Mousavi, A.S. Pirayeshfar. 2014. “Investigating
the Acoustical Properties of Carbon Fiber-, Glass Fiber-, and Hemp
Fiber-reinforced Polyester Composites”. Polymer Composites 35(12): 2103-2111.
12.
Rimkeviciene J., V. Ostasevicius, V. Jurenas,
R Gaidys. 2009. “Experiments and simulations of ultrasonically assisted
turning tool”. Mechanika 1:
42-46.
Received 16.07.2018; accepted in revised form 04.11.2018
![]()
Scientific
Journal of Silesian University of Technology. Series Transport is licensed
under a Creative Commons Attribution 4.0 International License