Article citation information:
Melnychuk, S., Vitiuk, I., Bovsunivskyi, I., Beherskyi,
D., Kubrak, Y. Vehicle suspension system modelling and simulation in the
SolidWorks software environment with motion analysis applications. Scientific Journal of Silesian University of
Technology. Series Transport. 2017, 97,
117-130. ISSN: 0209-3324. DOI: https://doi.org/10.20858/sjsutst.2017.97.11.
Serhiy MELNYCHUK[1],
Ivan VITIUK[2],
Ihor BOVSUNIVSKYI[3],
Dmytro BEHERSKYI[4],
Yuriy KUBRAK[5]
VEHICLE
SUSPENSION SYSTEM MODELLING AND SIMULATION IN THE SOLIDWORKS SOFTWARE
ENVIRONMENT WITH MOTION ANALYSIS APPLICATIONS
Summary. An
N1 vehicle model is created, which allows for changing suspension parameters
and conditions of experimental performance. A methodology of computer
testing performance for vehicle ride comfort and stability service properties’
characterization in a virtual environment is proposed. Vehicle suspension
system modelling and simulation are performed. The results of the N1 vehicle
suspension system from full-scale laboratory and road tests are given.
Keywords: stability; ride comfort; testing
methodology; vehicle suspension; cushioning; roll; vibration frequency
1. INTRODUCTION
Given that, in the process of building
mathematical models of vehicle motion or its suspension systems, designers and
engineers face difficulties in relation to copious factors, simplifications are
often applied. In the majority of cases, introducing simplifications can
significantly affect a product. Taking into an account this fact, along with
modern scientific progress, computer technological development, advances in
powerful engineering software products for difficult mechanical systems and
process descriptions, computer modelling and simulation are used for new
machines and assembly engineering.
Computer modelling and simulation significantly
speed up manufacturing processes at the planning stage, allow for tests to be
performed with the possibility to change a design and provide test conditions
that increase the quality of a product, promotes its implementation and reduces
its price.
Even at the planning stage, modern methods of
vehicle development allow for researching and developing cushioning and
vibrodamping systems, while estimating such characteristics as ride comfort,
stability and carrier system load by means of computer modelling and simulation
[3]. Methods of computer modelling and simulation can account for a majority of
suspension parameters that influence vehicle operation and its motion safety.
Modelling task priority lies in the definition
of system work parameters and the explanation of processes, which regulate
recognition and definition.
2. LITERATURE REVIEW AND PROBLEM STATEMENT
The analysis of recent publications
confirms that computer modelling and simulation are important parts in the
study of systems’ technological processes.
The modern market proposes a wide
range of computer-aided design (CAD) software products. Therefore, one of the
most critical tasks involves the choice of the software environment that will satisfy
the needs of designers, engineers and executives.
Software must ensure a project’s
design execution speed, a great source of software, a wide range of parametric
characteristics, the quality of the work performed, simplicity and ease of
professional service, work reliability, an easy mastering process, and constant
improvement. The most popular CAD systems in engineering were studied, with
their possibilities analysed and software packages compared, including their
features and functional peculiarities. In turn, the most appropriate system to
meet modern demands for software products created for home engineering
enterprises was defined.
Nowadays, the most popular CAD
systems include SolidWorks, T-Flex and
Компас, all of which satisfy appropriate
needs and requirements and are more often used in engineering.
SolidWorks CAD software,
manufactured by the SW Corporation, offers 3D design solutions of parts and
assemblies with possibilities to perform analyses of different types and create
design documentation.
In [6,7,8,9,11], a wide range of CAD
usage possibilities are presented in order to model and simulate assemblies’
interaction processes, as well as define basic development and existing
simulation models’ improvement streamlines. On the ADAMS/Car platform, a module
to analyse vehicle motion stability has been developed. The software allows for
changing suspension stiffness and damping parameters, the centre of mass etc.
It enables software users to input values of parameters for different types of
vehicle. But the software has many disadvantages as well, including the
simplification of many processes, which significantly affects the end result.
Notwithstanding a large amount of
the literature dedicated to the vehicle and its components modelling and simulation,
the issue of defining dependence of parameters of vehicle ride comfort and
stability on the quality of the work of its suspension system needs further
investigation. Moreover, existing models partly reflect processes in the
suspension systems.
3. AIM AND OBJECTIVES OF THE STUDY
The aim of
this paper is to forecast parameters of N1 vehicle ride comfort and stability
by means of computer modelling and simulation in the process of suspension
system design. The research objectives in this study are listed as follows:
–
To develop a computer model of N1 vehicle motion,
which allows for investigating ride comfort and stability and accounting for
design parameters of the suspension system.
–
To perform laboratory and road tests of the N1
vehicle suspension system.
–
To create a computer model and simulation of the N1
vehicle suspension system under conditions similar to the performed full-scale
tests and to compare results in order to state the adequacy of the computer
model.
–
To use the developed computer model in order to
investigate the designed suspension system on the basis of a four-bar linkage
assembly.
4. MATERIALS AND METHODS OF THE STUDY OF
OPERATIONAL PARAMETERS OF AN N1 VEHICLE: RIDE COMFORT AND STABILITY
A vehicle was chosen as a simulation
model on the basis that it is widely used in cities due to its mobility and
versatility. The cargo and passenger vehicle peculiarity involves significant
pressure difference in the sprung mass, which mostly occurs in the rear axle
(loaded-unloaded), while its operation in cities includes a turn, a three-point
turn and road positioning. Therefore, there are high expectations of ride
comfort and stability provision under different operational conditions with
such a vehicle.
For the purposes of the study, a
full-size simulation model of the experimental N1 vehicle was developed with
all its operational qualities. The Izh 2715 was chosen as an experimental
vehicle. All the necessary parameters and dimensions for developing a
simulation model were measured on this vehicle
The structural scheme represents
simulation model components in Fig. 1.
The analysis of modern scientific works on N1 vehicle
simulation model development and modelling and simulating mechanical systems
interaction has shown that, among a large number of CAD products, the
SolidWorks CAD software, manufactured by the SW Corporation, is one of the most
powerful and polyfunctional products.
SolidWorks software is developed for designing parts
and assembles, creating drawings, and testing performance to obtain different
types of data. The main advantage of this system is that the most powerful
manufacturers in the world have chosen it as standard. With powerful SolidWorks
solutions, modern machines and transfer lines are designed and produced within
automobile manufacturing enterprises. Unification reduces service and logistics
costs, while raising product quality.
To model and simulate vehicle motion kinematics
parameters, the Motion Analysis application was used, which is intended for
modelling and simulating dynamic systems in the SolidWorks software environment
and for assemblies’ motion simulation with allowance for kinematics and force
factors. The application is fully integrated with SolidWorks and creates a
geometric model, while calculation parameters and results notation are also
carried out in the SolidWorks model.
Fig. 1. The structural scheme of the vehicle
simulation model components
The data input procedure that was defined in order to
create a model is shown in Fig. 2.
Next, the SolidWorks assembly was analysed by means of
the Motion Analysis application, while its conversion to a nominal model was
performed with the parts’ mass-inertia characteristics taken into account. The
inertia parameters were taken from the SolidWorks parts geometry, with the
density parameter set for each element separately, irrespective of the
geometric form. Then, a motion differential equation set was proposed, which
was later solved by means of a difference scheme. Subsequently, the software
displayed the processed numerical results in a form suitable for
representation. At this point, the system again interacted with real geometry.
The computational kinematics model representation (in the form of thumbnails)
and results were performed in the SolidWorks graphics window on the background
of the SolidWorks assembly.
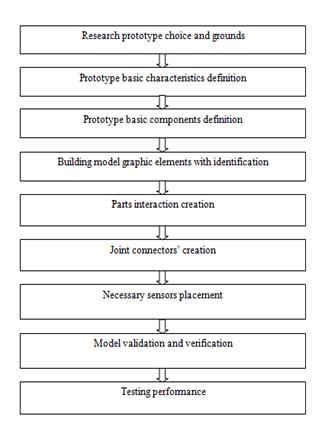
Fig. 2. The model building procedure
5. RESULTS
5.1. The study of N1 vehicle stability using a
simulation model
The study of N1 vehicle stability was performed on the
basis of the developed computer model.
From the laboratory measurements [2], the vehicle
suspension system’s basic characteristics were obtained, which were used for
the main virtual model of an experimental vehicle in SolidWorks Motion, along
with the basic suspension system and the suspension system, on the basis of the
four-bar linkage assembly.
These models (Fig. 3) include the vehicle and its
elements, along with all the mass-geometric parameters, inertia forces,
friction in the levers, damping elements, friction of a tyre with a bearing
surface, gravitational forces and other parameters.
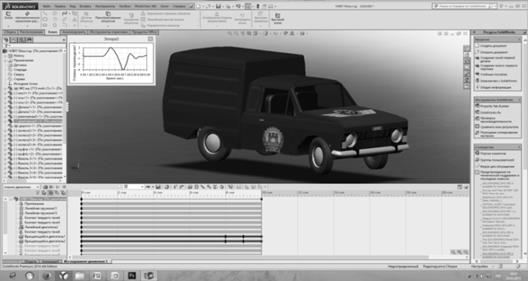
Fig. 3. N1 vehicle computer model developed to
study ride comfort and stability parameters
The simulation model was developed in such a way that,
at the beginning of the research, the vehicle moved parallel to the X-axis,
which was directed along a road. The N1 vehicle motion was studied at the time
interval t=10 s until the vehicle came to a complete stop. As a result of
numerical modelling by means of SolidWorks Motion, we obtained data on the
vehicle body position at any time with an interval part of 0.04 s at the 10-s
interval [10].
We performed the research on the vehicle dynamic model
with visualization, which allows for representing a model’s characteristic
movement along the designed part of the road in accordance with the applied
kinematics and force constraints and limitations.
The methodology was developed on the basis of GOST
52302-2004 in order to perform computer testing of a “20-m sharp lane change”
(Fig. 4). According to the proposed methodology, the vehicle gained the
necessary fixed speed and performed the “20-m sharp lane change” manoeuvre
without braking and speeding-up over a 20-m road distance, with a 7-m road
width.
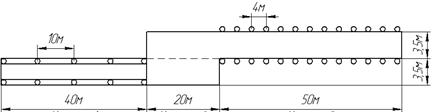
Fig. 4. The testing performance
scheme for the “20-m sharp lane change”
The developed methodology allowed us to perform
testing at different speeds with different vehicle workloads. The testing of a
“20-m sharp lane change” by the vehicle model was performed at a speed of 20-50
km/h with a speed part of 5 km/h (Fig. 5).
In the process of testing, a virtual angular movement sensor, which was
placed on the vehicle model body and operated relative to the bearing surface,
was used for the vehicle body roll registration.
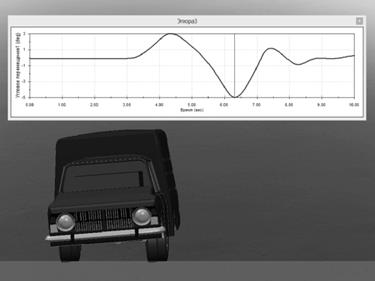
Fig. 5. The testing performance: the
vehicle body rolled with the factory-made suspension system in the process of
the “20-m sharp lane change” manoeuvre performance
Comparative graphs were created according to the
performed computer and road testing (Figs. 6-7). In the process of the “20-m
sharp lane change” manoeuvre performance at the speed of 50 km/h, the vehicle
body roll with the factory-made suspension system added up to 4.24°, while that
involving a suspension system on the basis of a four-bar linkage assembly
amounted to 3.09° under the same conditions in the process of the manoeuvre
performance.
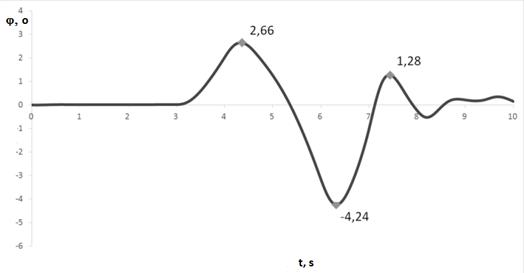
Fig. 6. The vehicle body roll with
the factory-made suspension system in the process of the “20-m sharp lane
change” manoeuvre performance
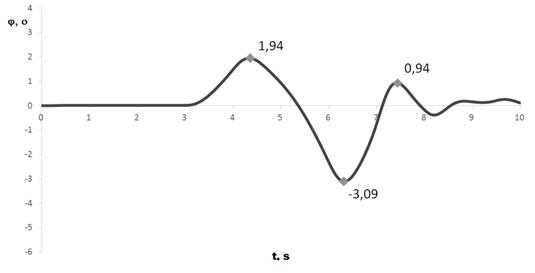
Fig. 7. The vehicle body roll with
the suspension system on the basis of the four-bar linkage assembly in the
process of the “20-m sharp lane change” manoeuvre performance
5.2. The study of N1 vehicle ride
comfort using a simulation model
Using the developed computer simulation model, we
investigated N1 vehicle ride comfort by means of a drop test method (Fig. 8).
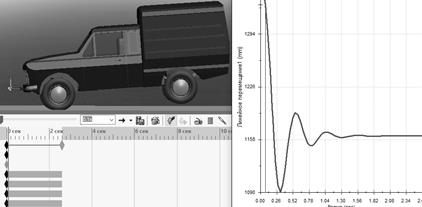
Fig. 8. The test performance: the
drop test
To perform the computer simulation testing, the
following vehicle computer research procedure by means of the drop test method
was used [1,2]:
- The
vehicle model was set on the virtual flat horizontal plane.
- The front
wheels were fixed and did not turn.
- The front
suspension system was fixed and did not vibrate.
- The
virtual movement sensors were set.
- It was
essential for the rear wheels’ height to comprise 55-65 mm relative to the
measurement plane.
- The
vehicle model was dropped, and the sprung and unsprung mass vibration process
was fixed.
- The tests
were repeated with a model load of 25, 50 and 75, and 100% of the vehicle load
carrying capacity.
- Vibration
process parameters were reported by means of the movement sensor embedded into
the Motion module.
The testing was performed for both the vehicle with
the factory-made suspension system (Fig. 9) and the one with the suspension
system on the basis of the four-bar linkage assembly (Fig. 10).
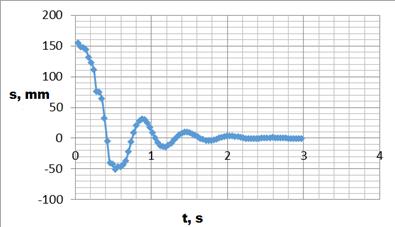
Fig. 9. The
dependence of the vertical vibration displacement, which took place in the
process of free vibrations of the sprung mass of the vehicle with the
factory-made suspension system
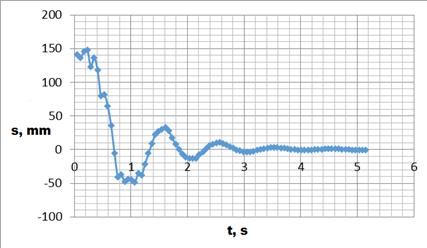
Fig. 10. The
dependence of the vertical vibration displacement, which took place in the
process of free vibrations of the sprung mass of the vehicle with the
suspension system, on the basis of the four-bar linkage assembly
For the vehicle with the factory-made suspension
system, the free vibrations frequency of the sprung mass changed in the range
from 1.33 to 1.8 Hz, according to the quantity of the vehicle body load. The
value of 1.33 Hz referred to the entirely loaded vehicle, and the value of 1.8
Hz referred to the unloaded vehicle, which corresponded to the actual values of
the free vibrations frequency of N1 vehicles with the factory-made spring
suspension system.
For the vehicle with the suspension system, on the basis
of the four-bar linkage assembly, the values of the free vibrations frequency
changed in the range from 0.8 to 1.05 Hz under the same conditions.
The obtained data on the computer modelling and
simulation of the vehicle model with different types of suspension systems
pointed to the proposed model adequacy and the fact that, even under the
limited conditions of the computer research, the suspension system, on the
basis of the four-bar linkage assembly, operated in the expected frequency
range.
5.3. The road testing of N1 vehicle stability
To validate and verify the available theoretical
computer and mathematical stability studies, we decided to perform a full-scale
testing of the factory-made suspension system of the experimental vehicle. For
this purpose, we developed a methodology for the road testing of the “20-m
sharp lane change” manoeuvre on the basis of GOST 52302-2004.
According to the proposed methodology, in a similar
manner to the computer testing, the vehicle gained the necessary fixed speed on
the hard bituminous concrete surface and performed the “20-meter sharp lane
change” manoeuvre without braking and speeding-up over a 20-m road distance,
with a 7-m road width, as previously indicated in the scheme (Fig. 4).
For recording vehicle motion speed, a reed sensor was
used, which was placed on the vehicle drum and sent signals to the computer by
means of an analogue-to-digital converter. For recording the vehicle body roll
change, a gyro sensor was used, which was placed in the vehicle body above the
rear axle. The testing was performed at a speed of 20-50 km/h with a speed part
of 5 km/h. The vehicle body load was created by sacks containing 25 kg of sand.
To improve accuracy, we repeated the testing four to five times under the same
conditions. For the purposes of visual control and analysis, we also recorded
the experiment with a high-speed camcorder with a frequency of 60
frames/second. We obtained the results in the form of graphs (Fig. 11).
The graph shows that, in the process of road testing,
the vehicle body roll amounted to 4.42° at a speed of 50 km/h under conditions
similar to those of the computer testing.
5.4. Full-scale laboratory testing of N1
vehicle ride comfort
To validate and verify the computer modelling and
simulation by means of the drop test, we decided to carry out laboratory
testing on the experimental vehicle using the same test.
For this purpose, we developed a procedure similar to
computer testing, which included the vehicle rear axle dropping on the hard
horizontal surface. The front axle was preliminarily fixed and did not turn or
vibrate (in order to avoid swinging and obtain free vibrations of the vehicle
rear axle). It was also necessary to fix an accurate ballast placement directly
and evenly above the rear axle. For recording free vibrations, a high-accuracy
accelerometer was used, which was placed in the middle of the body above the
rear axle. To process a signal, the accelerometer data were sent to a special
board, which communicated the signal to a personal computer. The data of the
vertical vibration acceleration of the vehicle rear axle appeared on the
personal computer by means of the special program (Fig 12).
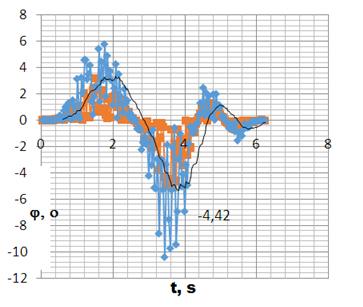
Fig. 11. The road
testing: the vehicle body roll with the factory-made suspension system in the
process of the “20-m sharp lane change” manoeuvre performance
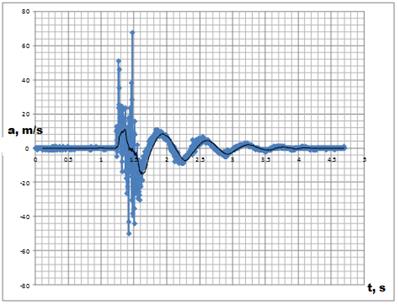
Fig. 12. The
laboratory testing by means of the drop test: the vibration acceleration of the
rear axle of the vehicle with the factory-made suspension system
The obtained experimental data validated both the
theoretical calculations and the results of the computer modelling and
simulation. Under the same conditions, the factory-made suspension system
operated in the range of 1.33 to 1.67 Hz, while the proposed system, on the
basis of the four-bar linkage assembly, operated in the range of 0.91 to 1.17
Hz. In comparison with the computer model, the regularity of distribution of
the operating frequencies, at which the suspension systems being studied
operated, remained. This validated the chosen procedure and validated the
necessary evidence resulting from the performed research.
6. DISCUSSION OF THE RESEARCH RESULTS OF N1
VEHICLE RIDE COMFORT AND STABILITY
Using the developed simulation model, testing was
performed to define the vehicle service properties. We managed to improve ride
comfort and stability by means of changing the vehicle’s factory-made spring
suspension system into one on the basis of a four-bar linkage assembly.
In the process of “20-m sharp lane change” experiment,
at a speed of 50 km/h, the maximum roll angle of the vehicle with the
factory-made suspension system amounted to 4.24°; in the process of testing the
suspension system on the basis of the four-bar linkage assembly, the roll angle
added up to 3.09°. Furthermore, the critical speed of the manoeuvre performance
was defined: the critical speed with the factory-made suspension system
amounted to 60 km/h, while the one with the suspension system on the basis of
the four-bar linkage assembly added up to 65 km/h. Thus, the testing results
proved that, under the same conditions, the vehicle performed the manoeuvre
with more stability using the suspension system being studied.
Having analysed the obtained value of the sprung mass
vibrations frequency reported in the modelling and simulation results (Figs.
9-10), it may be concluded that the sprung mass vibrations frequency for the
factory-made suspension system added up to 1.33 Hz with the entire load (sprung
mass of 520 kg), while the one for the suspension system on the basis of the
four-bar linkage assembly amounted to 0.8 Hz [5].
The results of the performed research pointed to the
fact that using the new suspension system significantly improves the vehicle’s
ride comfort and stability parameters. Thus, the proposed N1 vehicle suspension
system is both practical and expedient in terms of usage.
7. CONCLUSIONS
A virtual model of the vehicle was developed in order
to perform computer testing of the ride comfort and stability parameters. The
proposed model allowed for the fast changing of such parameters as vehicle
weight, height of the centre of mass and suspension system types. Besides, the
model can easily adapt to different research conditions. Thus, the proposed
model is suitable for performing research on the vehicle ride comfort parameter
by means of such methods as the drop test, a head-on crash and driving on
setts, and the vehicle stability parameter by means of a sharp lane change, a
turn or a moose test.
The standard research procedures of the ride comfort
and stability parameters, by means of the drop test and the sharp lane change,
were adapted for use in the proposed vehicle computer model.
Research on the stability parameters of the vehicle
with the factory-made suspension system and with the suspension system on the
basis of the four-bar linkage assembly was performed. The vehicle with the
suspension system on the basis of the four-bar linkage assembly demonstrated a
60% decrease in the free vibrations frequency of the sprung mass, compared with
the vehicle with the factory-made suspension system. Research on the ride
comfort of the vehicle with the factory-made suspension system and with the
suspension system on the basis of the four-bar linkage assembly was also
performed. The vehicle with the suspension system on the basis of the four-bar
linkage assembly demonstrated a decrease in the roll angle of 37%, compared
with the vehicle with the factory-made suspension system, and a decrease in the
critical speed under the condition of an 8.3% stability loss.
References
1.
Мельничук
С.В., Ю.О.
Подчашинський,
І.В. Вітюк, І.А.
Бовсунівський.
2010. “Визначення
параметрів плавності
ходу моделі
підвіски на
основі чотириланкового
важільного
механізму”. Вісник
ЖДТУ 55 (4): 25-28. [In Ukrainian: Melnychuk
S., Y. Podchashynskyi, I. Vitiuk, I. Bovsunivskyi. 2010. “Determination of the
parameters of smoothness of the pendant model on the basis of a quadrilateral
lever mechanism”. Visnyk ZhDTU 55
(4): 25-28.]
2.
Мельничук
С.В., І.В. Вітюк,
І.А.
Бовсунівський.
2014. “До питання
підвищення
показників
плавності
ходу
автомобіля
категорії М1.
Програмно-апаратний
комплекс для проведення
натурного
дослідження
підвіски”. Сучасний
технології в
машинобудуванні
та
транспорті.
Науковий
журнал 1: 73-80. [In Ukrainian:
Melnychuk S., I. Vitiuk, I. Bovsunivskyi. 2014. “On the issue of increasing the
speed of the car category M1. Software and hardware complex for conducting a
full-time study of a suspension bracket”. Modern
Technology in Mechanical Engineering and Transport. Scientific Journal 1:
73-80.
3.
Бугаєв А.В.,
В.О. Занора, Р.В.
Юринець. 2008.
“Аналіз
сучасних
САПР і їх
порівняльна
характеристика”.
Вісник
ЧДТУ 1: 96-99. [In Ukrainian: Buhaiev A., V.
Zanora, R. Yurynets. 2008. “An analysis of modern spares and their comparative
characteristics”. Bulletin of the ChSTU
1: 96-99.]
4.
Tang A.H., O.
Jian, G. Hong Deng. 2010. “Modeling and kinematics characteristic analysis of
twist beam rear suspension using ADAMS/Car”. Advanced
Materials Research 139: 1056-1059. Trans Tech Publications.
5.
Shim T., P.C.
Velusamy. 2006. “Influence of
suspension properties on vehicle roll stability (No. 2006-01-1950)”. SAE
Technical Paper. DOI: https://doi.org/10.4271/2006-01-1950.
6.
Chen J., M. Qin,
Y. Jiang, L. Jin, Y.P. Chang. 2015. “Modeling, analysis and optimization of the twist beam
suspension system”. SAE International Journal of Commercial Vehicles
8 (2015-01-0623): 38-44.
DOI: https://doi.org/10.4271/2015-01-0623
7.
Волохов
О.С. 2008. “Моделирование
динамики
легкового
автомобиля с
учетом
взаимовлияния
продольных и
поперечных
сил в пятне
контакта
колес”. Вісник
Східноукраїнського
національного
університету
імені
Володимира
Даля 125 (7): 176-179. [In Russian: Volokhov O.S. 2008. “Modeling of passenger car dynamics, taking into
account the mutual influence of longitudinal and transverse forces in the
contact spot of wheels”. Bulletin of
the Volodymyr Dahl East-Ukrainian National University 125 (7): 176-179.]
8.
Гацько
В.І., М.А.
Подригало,
А.І. Коробко. 2010. “Підвищення
точності
вимірювання
параметрів
руху
автомобілів
у процесі
динамічних
випробувань”. Метрологія
та прилади.
Науково-виробничий
журнал 3: 49-52. [In Ukrainian:
Gatsko V.I., M.A. Podrygalo, A.I. Korobko. 2010. “Improvement in the accuracy
of the measurement of automobile movement parameters in the process of dynamic
testing”. Metrology and Devices.
Scientific and Production Journal 3: 49-52.]
9.
Артюшенко
А.Д., О.Г.
Суярков. 2013. “Дослідження
впливу
характеристик
підвіски
автомобіля
малого класу
на плавність ходу
та її
модернізація”. Вісник
НТУ«ХПІ».
Серія:
Транспортне
машинобудування.
Харків:
НТУ«ХПІ», 1004 (31): 21-27. [In Ukrainian:
Artyushenko A.D., O.G. Suyarkov. 2013. “Investigation of the influence of
characteristics of the suspension of a car of a small class on smooth running
and its modernization”. Bulletin of the
NTU “KhPI”. Series: Transport Engineering 1004 (31): 21-27. Kharkiv, NTU
“KhPI”.]
10.
Макаров
В.А., А.Є.
Бондаренко,
О.С. Волохов,
А.В. Куплінов.
2012. “До питання
визначення
похибок при
проведенні
експериментального
дослідження
курсової
стійкості
руху
автомобіля”. Вісник
Східноукраїнського
національного
університету
імені
Володимира
Даля 180 (9)
Частина 1: 131-136.
Луганськ. [In Ukrainian: Makarov
V.A., A.E. Bondarenko, O.S. Volokhov, A.V. Kuplinov. 2012. “On the issue of
determining the errors in conducting an experimental study of the exchange rate
stability of the car”. Bulletin of the
Volodymyr Dahl East-Ukrainian National University 180 (9) Part 1: 131-136.
Lugansk.
11.
Corman, F.,
D’Ariano, A., Pacciarelli, D. 2010. „Centralized versus distributed systems to
reschedule trains in two dispatching areas”. Public Transport 2(3): 219-247.
https://doi.org/10.1007/s12469-010-0032-7.
Received 10.08.2017; accepted in revised form 11.11.2017
![]()
Scientific Journal of Silesian
University of Technology. Series Transport is licensed under a Creative
Commons Attribution 4.0 International License